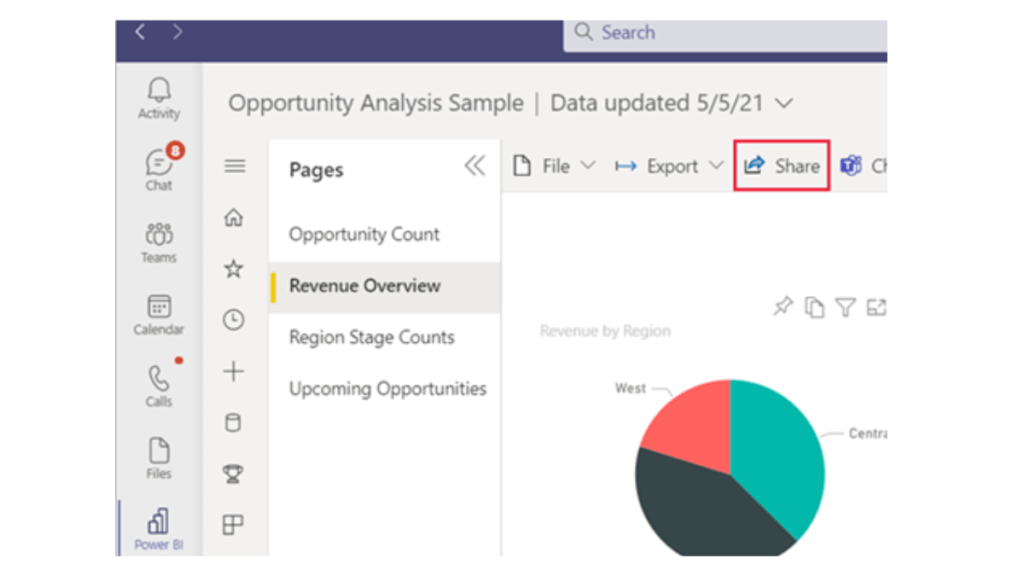
Power BI: As businesses and organizations continue to rely on remote work solutions, Microsoft Teams has become a go-to application for many. Its features, ease of use, and integration with other Microsoft applications make it a powerful tool for collaboration and communication. Teams Admin Center (TAC) provides valuable insights into the usage and adoption of Teams within an organization. However, to truly gain actionable insights, we need to export and analyze the data in tools like Power BI. In this article, we will walk you through the process of exporting data from TAC and importing it into Power BI for analysis.
Table of Contents
Step 1: Accessing Teams Admin Center
To access TAC, you must have appropriate permissions within your organization. Once you have the necessary permissions, log in to the Microsoft Teams Admin Center at admin.teams.microsoft.com. Once you’re logged in, select the “Analytics & Reports” option from the left-hand menu.
Step 2: Accessing Call Quality Dashboard (CQD)
Open TAC–> From the “Analytics & Reports” page, select “Call Quality Dashboard (CQD)” from the options presented. CQD is a powerful tool that allows you to analyze the quality of audio and video calls made using Teams. Once you’ve selected CQD, you will be presented with a dashboard that provides an overview of call quality for your organization.
Step 3: Filtering CQD Data
CQD allows you to filter data based on a variety of criteria. For example, you can filter data based on location, device type, and network quality. To filter data in CQD, click on the “Filter” button at the top of the page. From there, you can select the criteria you want to filter by.
Step 4: Exporting CQD Data
Once you’ve filtered your data, you can export it for further analysis. To export data from CQD, click on the “Export” button at the top of the page. From there, you can select the format you want to export your data in. CSV is a good format to use if you plan to import your data into Power BI.
Step 5: Importing CQD Data into Power BI
Now that you’ve exported your data from CQD, it’s time to import it into Power BI. Open Power BI and select “Get Data” from the home screen. From there, select “Text/CSV” as your data source and navigate to the location where you saved your exported data. Once you’ve selected your file, Power BI will automatically detect the format and preview your data. If everything looks good, click “Load” to import your data into Power BI.

Step 6: Analyzing CQD Data in Power BI
Once you’ve imported your data into Power BI, you can use its powerful visualization tools to gain insights into call quality within your organization. For example, you can create a map that shows call quality by location or a bar chart that shows call quality by device type. The possibilities are endless, and the insights you gain can help you improve the overall quality of communication within your organization.
Frequently asked questions
Is there a limit to the amount of data that can be exported from CQD?
No, there is no limit to the amount of data that can be exported from CQD.
Can I schedule automatic exports from CQD?
Yes, you can schedule automatic exports from CQD
Don’t forget to support us by following us on Google News or Returning to the home page TopicsTalk
Join Telegram and WhatsApp for More updates
Follow us on social media


